
Description of the course
This course covers software quality, software process, and software process improvement. It introduces the software quality assurance and the importance of process quality. Various existing software development methodologies are also studied. The later part discusses software process improvement. Various models that support software process improvement are presented, and these include the CMMI, ISO 9000, SPICE, PSP and TSP.
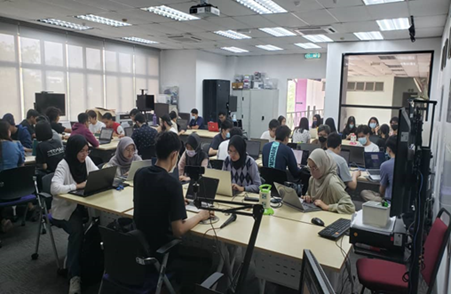
Description of the participants
Participants are enrolled in Bachelor’s of Computer Science Software Engineering program. A total of 66 students attended the courses in semester 2 of academic year 2022 – 2023.
Description of gamified design thinking activities
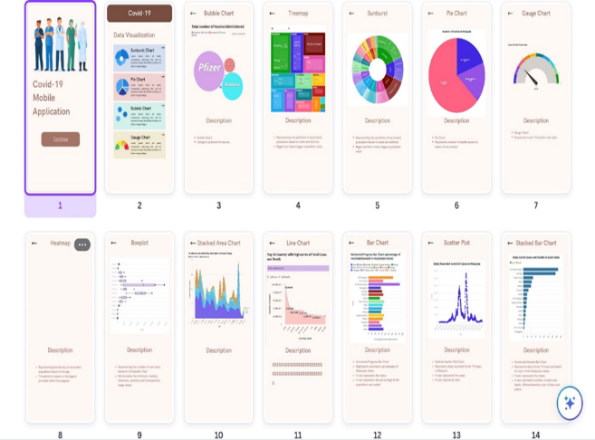
The course includes a semester-long project, in which students are challenged to develop a high-quality mobile or web application that uses data visualization techniques to provide users with powerful insights into their data. Students are asked to design the application with an emphasis on usability, portability, maintainability, and reliability. They incorporate software improvement processes and software assurance plan to ensure the highest possible level of software quality. Students use design thinking to synthesize innovation solutions on software quality.
The application should be design to:
- Support a range of different visualization goals, including comparison, trend identification, correlation, distribution, ranking, proportion, composition, exploration, explanation, prediction, anomaly detection, clustering, dimensionality reduction, decision-making, communication, feedback, forecasting, identification of patterns and outliers, evaluation, and user engagement.
- Incorporate a variety of visualization techniques, including bar charts, line charts, scatter plots, pie charts, histograms, box plots, tree maps, sunburst charts, infographics, heat maps, bubble charts, dendrograms, scorecards, KPI dashboards, and balanced scorecards.
- Offer an intuitive interface that allows users to easily upload their data, select the visualization techniques they want to use, and customize their visualizations to meet their needs. Incorporate interactive elements, such as the ability to zoom in and out of data, toggle between different visualization modes, and filter data based on different criteria.
- Target a range of different users, including business professionals, data analysts, researchers, and educators. Be available on both iOS and Android platforms and be designed to run smoothly on both smartphones and tablets.
Work was organized in the following steps:
Step 1. Empathy and definition.
Students elicited and analyzed software requirements.
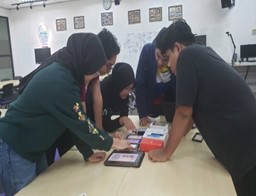
Step 2. Ideation.
Students sketched and structured their ideas on how to design the application.
Step 3. Application design.
Students introduced the conceptual design and wireframing of the application user interface. This activity further involved the task of data processing and cleaning, for ensuring that data was suitably formatted for visualization. In addition, this task involved the selection of appropriate data visualization techniques. Finally, students designed an intuitive interface that allows users to easily upload and visualize their data.
Step 4. Prototyping.
Students coded and programmed the application using a suitable programming language and platform.
Step 5. Testing and refinement.
Students tested the application to identify bugs and issues and refining it to improve performance and user experience.