
Description of the course
The objective of the course is to build knowledge on presenting information in an understandable, efficient, effective, and aesthetic manner for the purposes of explaining ideas and analyzing data. Another objective is to build skills in designing and evaluating information visualizations and other forms of visual presentation. Students become familiar with core principles and some of the literature of the field. The ICT-INOV digital learning platform was introduced in this course in 2022.
Description of the participants
The course is mandatory in the 2nd semester of the Master’s program in Computer Engineering, Specialization: Data Science and Analytics, conducted by the Department of Electronics and Computer Engineering, Pulchowk Campus, Institute of Energy, Tribhuvan University. A total of 20 graduate students in their 1st year of graduate studies were engaged in the course. ICT-INOV will be further deployed in the following academic years.
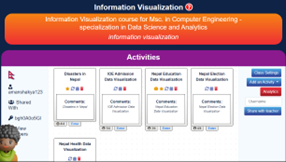
Description of gamified design thinking activities
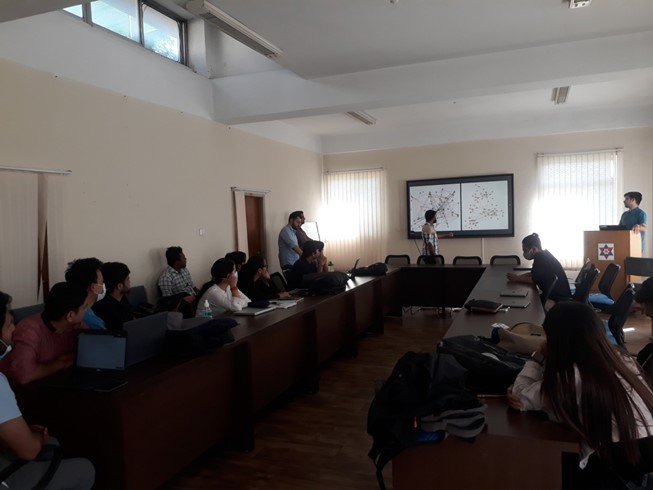
Students worked in 5 groups that consisted of 4 individuals each. Each team worked on an individual project. Students used the ICT-INOV lab for visualizing information. A dedicated activity was developed in the ICT-INOV platform, was organized in the following steps.
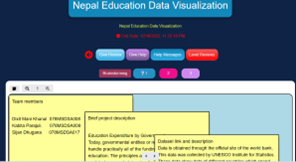
Step 1. Team formation and project background study.
Students were asked to form groups of up to 4 individuals and choose a name and logo for the team. Subsequently, groups were asked to select a project topic from a list of projects provided by the instructor or to introduce a different topic of their choice. Students were asked to post a description of the project along with their team’s name and group members on the ICT-INOV platform.
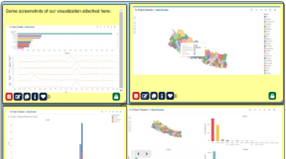
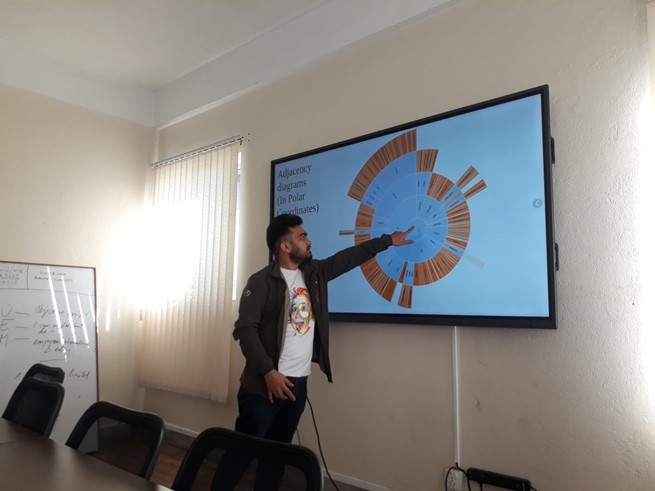
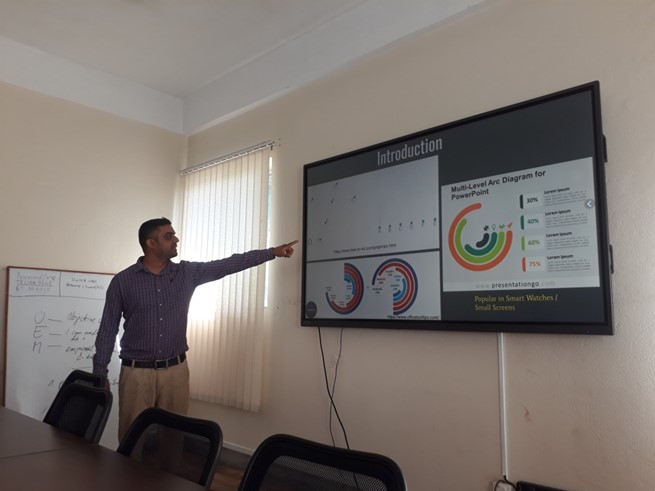
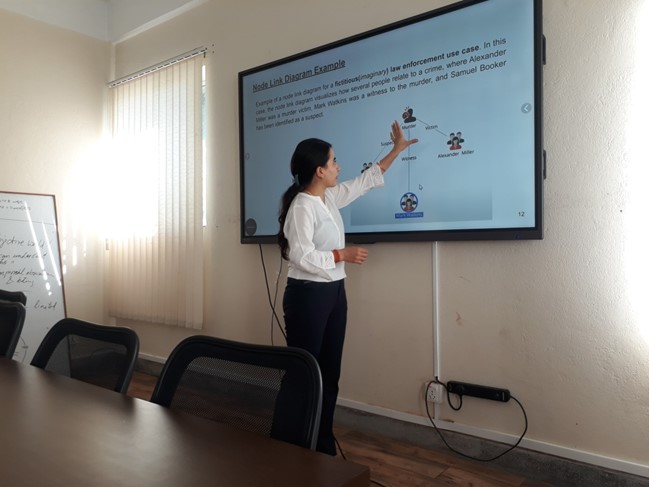
Step 2. Information visualization. Students explored the domain and developed several information visualizations using tools like Tableau®.
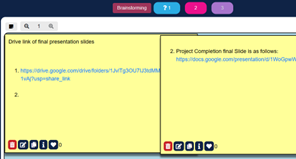
Step 3. Final submission of deliverables. Students submitted the final deliverables including the wrangled datasets, final information visualizations, source code, and presentation slides.